Organising institution: Karpos
Country: Greece
Age: 11- 17 years
Key question: Can information, data or knowledge be presented in a visual way in order to become more understandable and easily remembered by a wider audience?
Objectives: To investigate visual and verbal elimination, to investigate the relation between verbal and visual communication, to experiment with the visualization of information and to be able to create an infographic.
Time: 6 hours
Software and apps to be used: logomakr.com, piktochart.com, mentimeter.com (optional), post-it app (optional).
Brief presentation: Students experiment with verbal and visual abstraction. They are introduced to the concept of symbols and they create their own. They study how verbal and visual communication (text and symbols) can be combined to create a visual representation of a set of information. Finally they create their own infographic in order to communicate a set of information/knowledge in a quick and easy way.
Topics covered: Can be applied to any topic of the school curriculum.
Civic engagement: The final product of the workshop, the infographic, can be used to communicate information to other students or the local community.
Preparation of space for the Atelier: The space needs to have internet access, large tables for working in teams, one laptop/computer per team, a projector or screen, scanner or photocopier (optional).
Materials needed: Black papers, A4 pages, pencils, erasers, colored pencils.
Main inspirations taken from personal research: Main inspirations for this atelier were: Bruno Munari’s approach on visual elimination, the work and workshops of Zaffiria on symbols and communication via symbols, ideograms and emojis.
Mass media and social media connections: Explore the theme of symbols and ideograms, how are they used in everyday life (road signs, emoticons in social media).
How do you plan to give voice to students to present or show their personal skills and knowledge? As an introduction to the atelier students should fill the ‘What you don’t know about me’. This can be used by the teacher to learn about his/her students’ skills and maybe separate them accordingly into teams. Also, brainstorming in teams (optionally using post-it notes or the post-it app). In the second phase the teams can be split in smaller groups, thus giving space to quitter students to express.
How do you collect information as the starting point of a Digital Atelier? The students fill in the ‘What you don’t know about me sheet’.
Introducing students to the key question – the research begins: To what point can we remove content without losing the meaning?
Experimental phase
Action that unfolds the practical activity to clarify the question and advance to the first answers: During this session the students experiment with verbal and visual elimination.
1. Verbal Elimination 45 ‘:
a) The teacher chooses a text on a topic that he wishes to investigate with the students.
b) The teacher divides the students into groups and asks each group to make a summary of the text, a summary/synopsis so small that the basic meaning is not lost.
Tips: The initial text given by the teacher shouldn’t be more than half a page; It will be useful for the students to start by finding the key words of the text
c) Presentation of results, each group reads out their summary (and key words), discussion
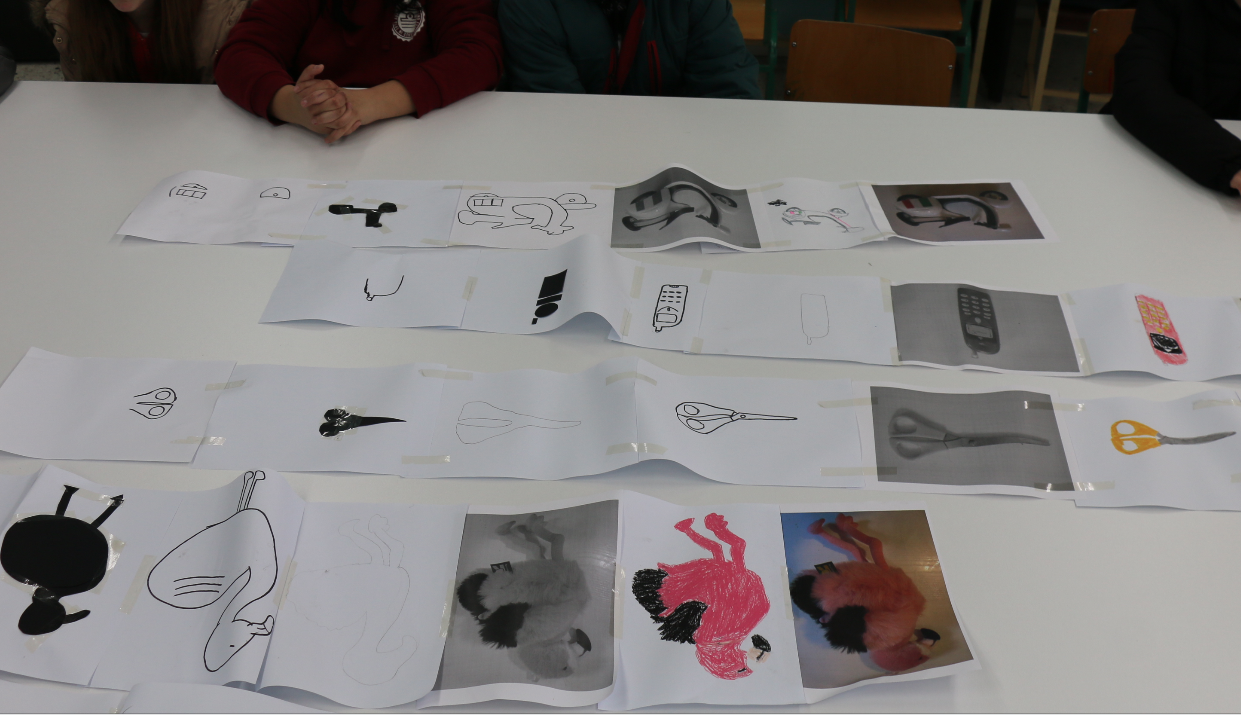
2. Visual Elimination 45 ‘:
a) The teacher chooses objects that are related to the topic, one for each team. Each team uses the ‘Bruno Munari method of visual elimination’ to create a symbol of their object (Appendix 1). Example: If the topic chosen by the teacher were ‘The teenagers’ addiction to the internet’, then he/she could have chosen objects such as a keyboard, a mouse, a smartphone, a usb storage device, a cable etc…
Tips: In order to save time: each group can divide the stages of the ‘Bruno Munari elimination method’ between its members; the teacher can prepare beforehand the first two stages of the ‘Bruno Munari elimination method’ by photographing each object and printing it both in colour and inblack and white.
3. Presentation of results and discussion.
Active work of the students: Can we make a visual symbol of a concept/ idea? What is a symbol? (presentation in Appendix) The teacher has prepared a series of symbols (maybe 4 or 5) that are put in such an order as to create a narration (relevant to the topic of study). He/ she hands them on a piece of paper to the students. Each group tries to make sense of the narration and write it down in a small paragraph.
Tip: The teacher can use readymade symbols from the internet, or create his/her own using the platform logomakr.com
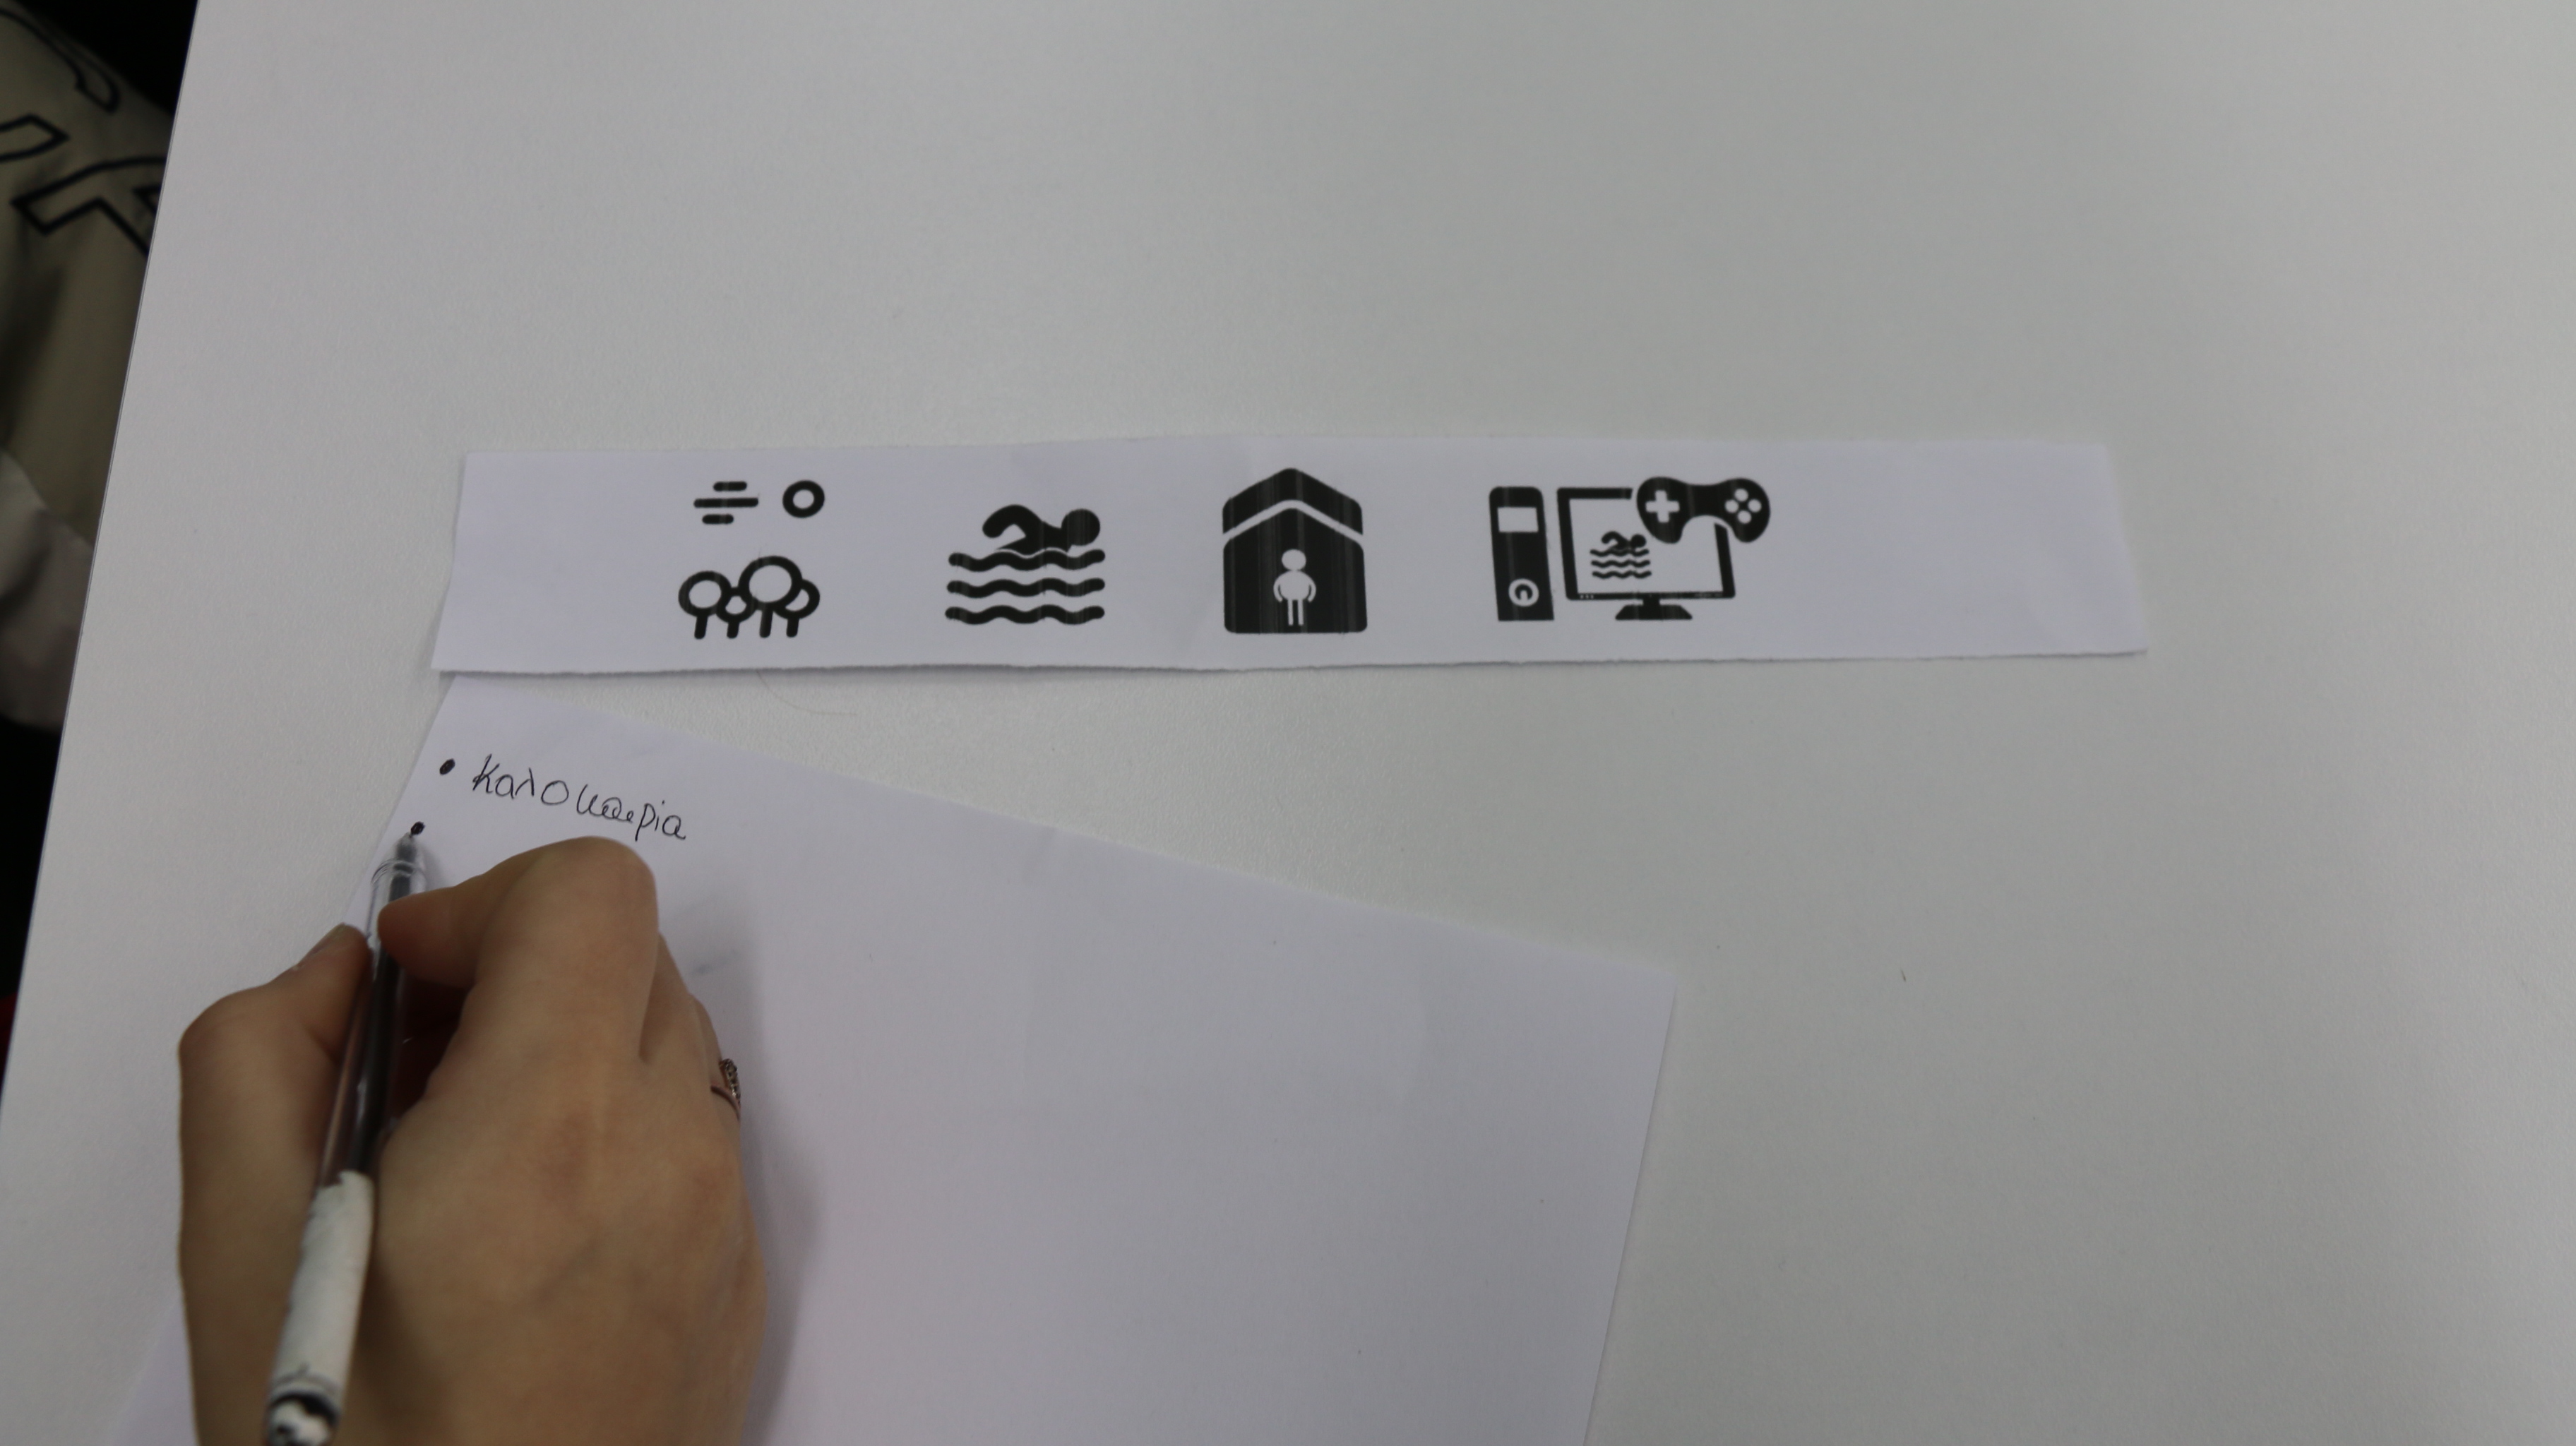
Presentation of findings and results (visualization of information): Presentation of results, discussion in class.
Tip: The teacher can prepare more than one set of symbols, however at least two groups must work on the same set so they can compare their approach.
Project/design phase – part 1
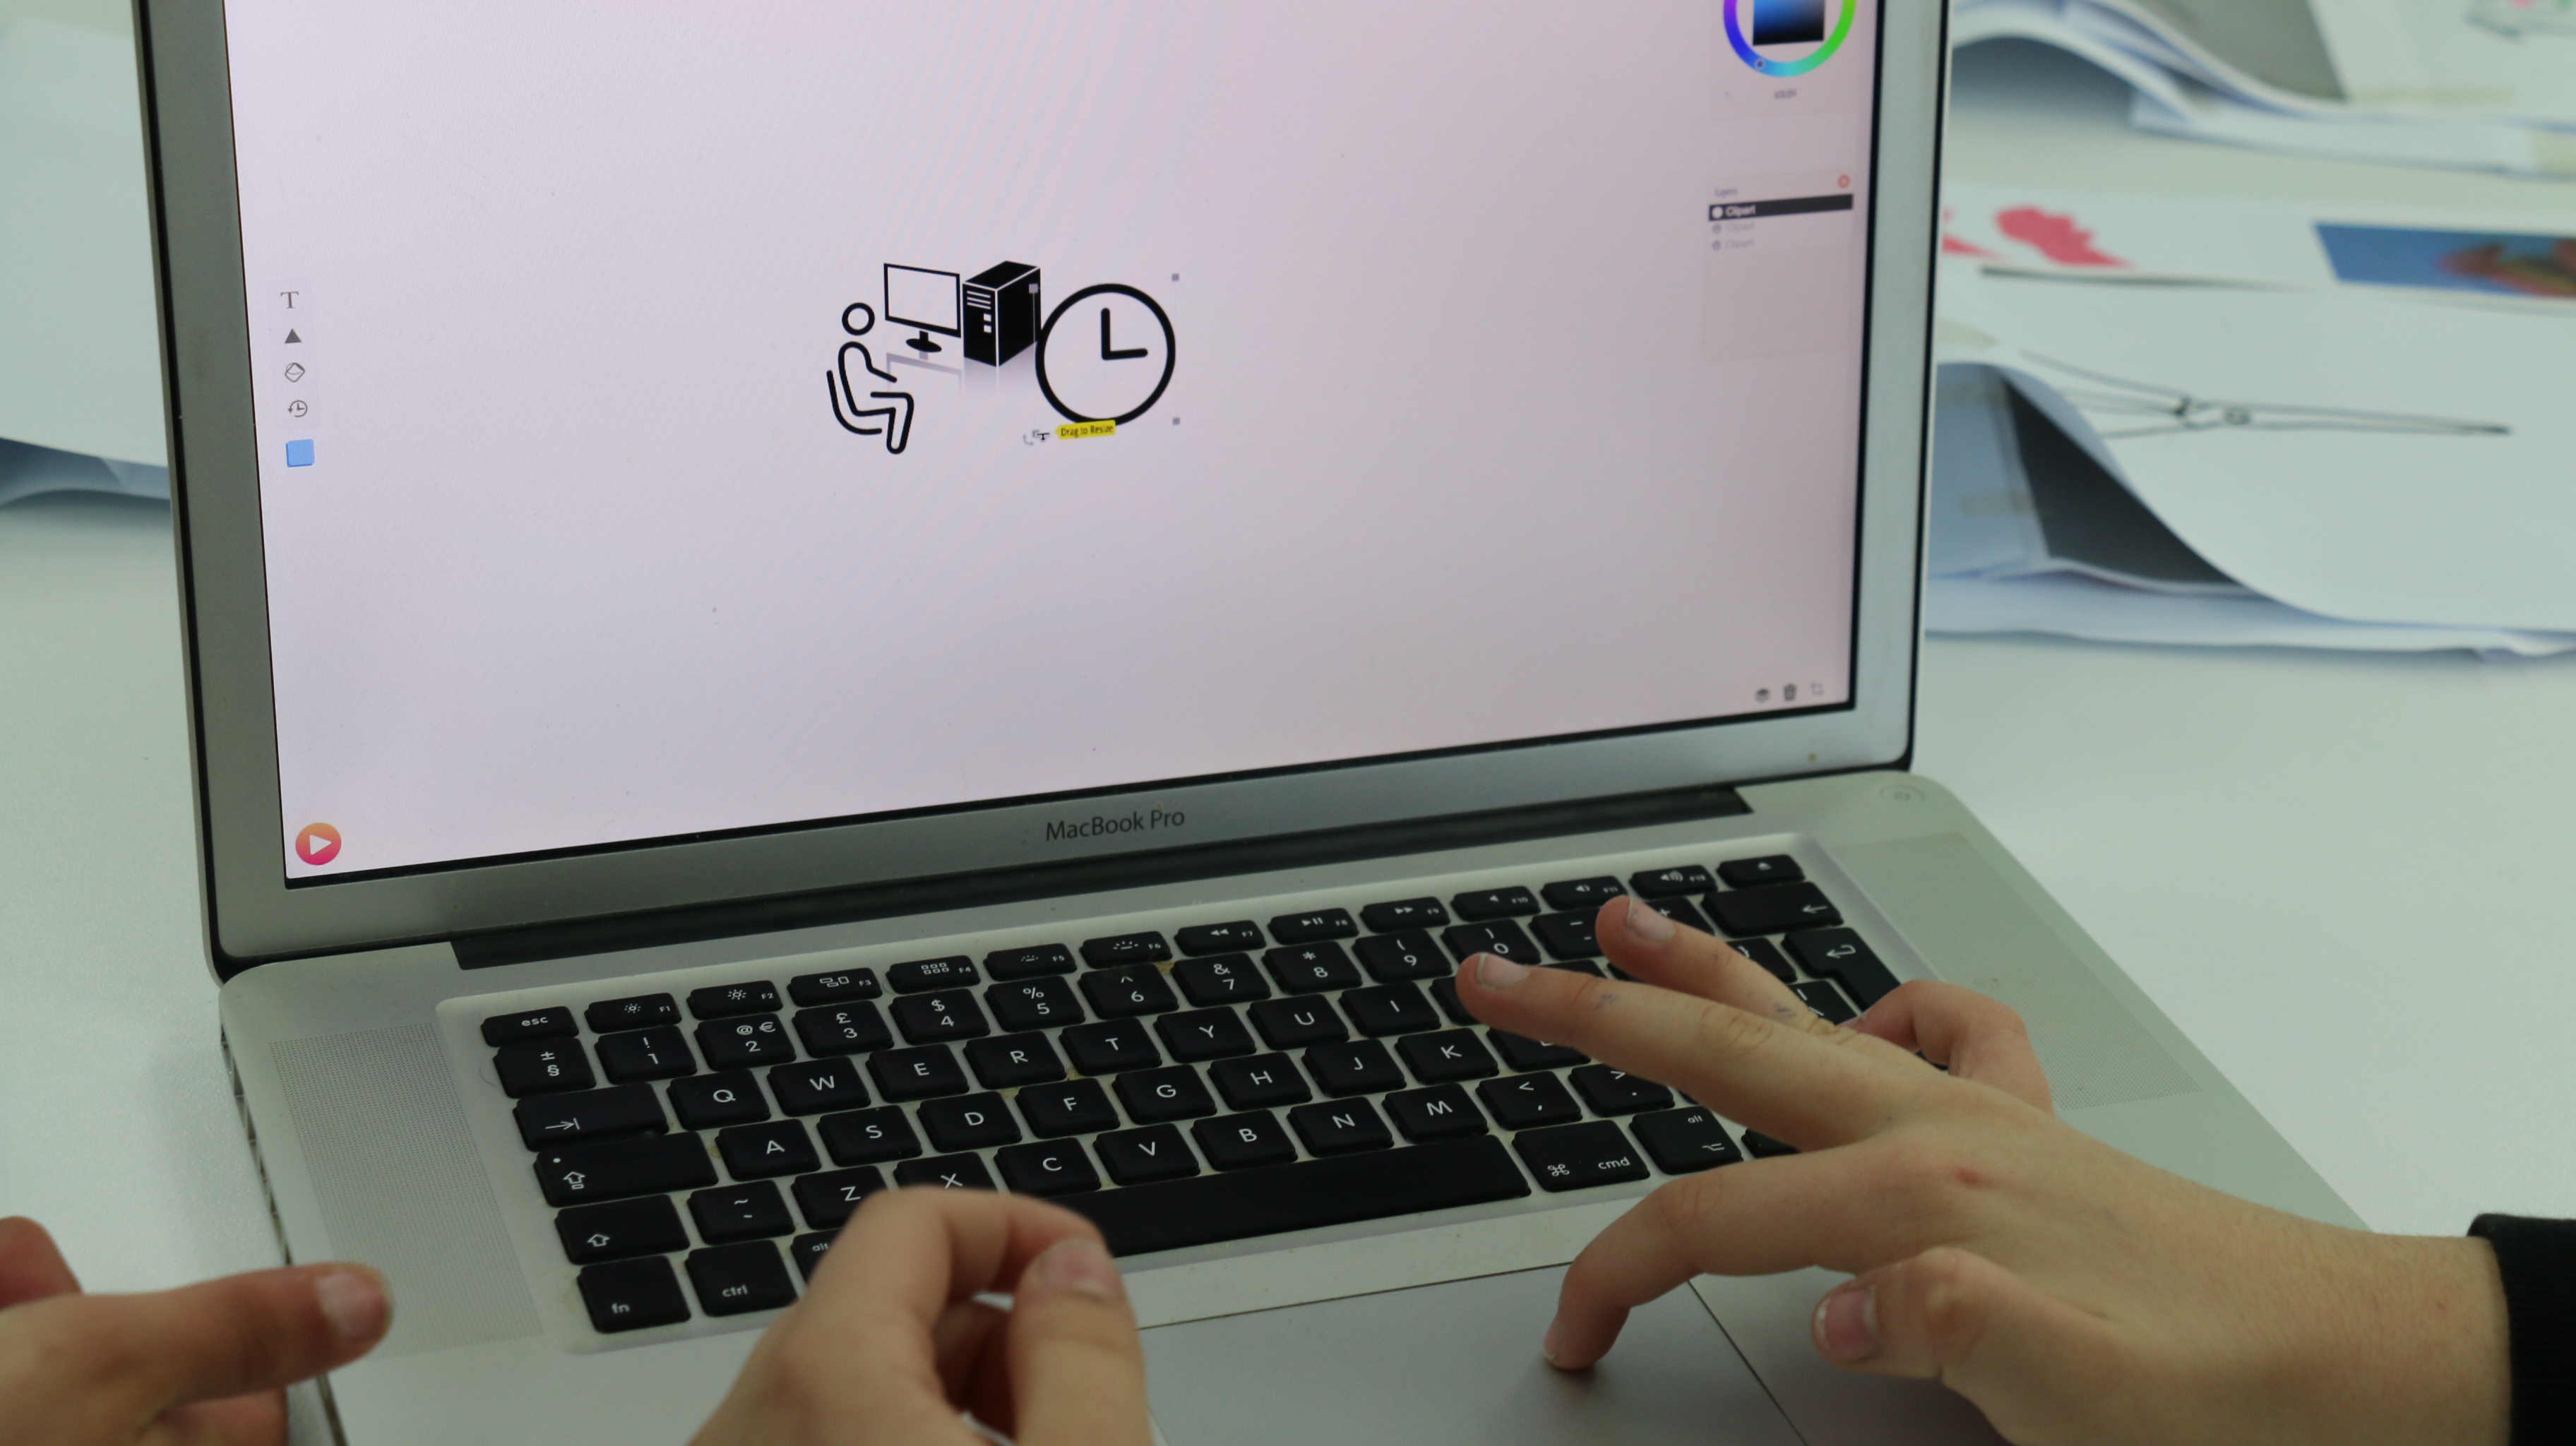
- Second action that unfolds the practical activity: The teacher introduces α concept/ idea related to the topic of investigation and asks the groups to create a logo for it. For example, if the topic of investigation was the ‘The teenagers’ addiction to the internet’, the teacher could ask: If teenagers had a logo, what would that be? Or, what could the logo of ‘internet addiction’ be?
- Active work of the students: Each group uses the platform logomakr.com to create their own unique logo.
- Presentation of findings and results (visualization of information): The groups present their work. Tip: The teacher can choose to give more than one concept/idea so the students prepare more logos. That would be useful for next stage (creating an infographic).
- Analysis of results: The platform metimeter.com could be used to vote for the most relevant, imaginative logo. (optional)
Project/design phase – part 2
- Third action that unfolds the practical activity: How can we combine words and symbols to communicate a set of information in an easier and quicker manner? What is an infographic? How do I make an infographic? Presentation of examples and tips (Appendix).
- Active work of the students: Each team is asked to create an infographic, transforming written information related to the topic of investigation (given by the teacher) into a combination of symbols and key words. The students design their infographic in piktochart.com
- Presentation of findings and results (visualization of information): Each group present their infographic. Note: maybe each group can work on a part of the same infographic, so in the end the final infographic is made by putting together the work of all teams.
- Analysis of results: Is there a proper analogy between text and symbols? Did I achieve my purpose? This can be tested by presenting the infographics to fellow students/ putting the infographics up in the school’s walls. Tip: Data visualization is an important step in raising knowledge and bridging the gap between information, meaning and understanding. The aim is to use the most comprehensive and little text possible.
Approach to a new software or a new app: The students try out and experiment themselves with the apps.
Links between the Digital Atelier and real life of the students: The students have seen infographics on the internet and social media. Through this atelier they get the chance to design them themselves. Furthermore, they take part in an attempt to pass on information to their fellow students (or other teenagers, fellow citizens, etc) in an easy and quick manner. This information could be related to a difficult subject from their curriculum, or a social/ local subject that concerns them. The final infographics can be shared with teachers from other classes or used throughout the school (or neighborhood).
How do you plan to evaluate knowledge and skills? By the actual end result (production of infographics).
Conclusion: Following the stages of this atelier the students research on subject areas in a playful way, they can have a holistic view of different subject areas or even visualize and better understand more difficult aspects of their school subjects or local issues, while they try to engage other students, too.